
plz explain the ellingham diagram more clearly with examples as it is not clear


Ellingham diagram
Ellingham diagrams are plots of change in standard free energy with respect to temperature for various reactions like the formation of oxides, sulfides etc. of various elements. All Ellingham diagrams are basically straight lines except at very high and very low temperatures.
In metallurgy, the Ellingham diagram is used to predict the equilibrium temperature between a metal, its oxide and oxygen, and by extension, reactions of a metal with sulphur, nitrogen and other non-metals. The diagrams are useful in attempting to predict the conditions under which a metal ore will be reduced to the metal.
Contents[hide] |
[edit] Thermodynamics
Ellingham diagrams follow from the Second Law of Thermodynamics [ΔG = ΔH - TΔS] and are a particular graphical form of it. ΔG is the Gibbs Free Energy Change,ΔH is the Enthalpy Change and ΔS is the Entropy Change]
The Ellingham diagram plots the Gibbs free energy change (ΔG) for the oxidation reaction versus the temperature. In the temperature ranges commonly used, the metal and the oxide are in a condensed state (liquid or solid) with the oxygen gaseous, the reactions may be exothermic or endothermic, but the ΔG of the oxidation always becomes more negative with lower temperature, and thus the reaction becomes more probable statistically. At a sufficiently high temperature, the sign of ΔG may invert (becoming negative) and the oxide can spontaneously reduce to the metal.
As with any chemical reaction prediction based on purely energetic grounds the reaction may or may not take place spontaneously on kinetic grounds if one or more stages in the reaction pathway have very high Activation Energies EA.
If two metals are present, two equilibriums have to be considered, so that the metal with the more negative ΔG reduces, the other oxidizes.
[edit] Salient Features
- Curves in the Ellingham diagrams for the formation of metallic oxides are straight lines with a positive slope.
- The lower the position of a metal in the Ellingham diagram more is the stability of its oxide. For example, the Ellingham diagram for Al is found to be below Fe2O3.
- A metal found in the Ellingham diagram can act as a reducing agent for a metallic oxide found above it. Thus, Al can act as a reducing agent to Cr which is above it in the diagram.
- The greater the gap between any two lines, the greater the efficiency of the reducing agent.
- Stability of metallic oxides decrease with increase in temperature. Highly unstable oxides like Ag2O and HgO easily undergo thermal decomposition.
- The formation enthalpy of carbon dioxide (CO2) is almost a temperature-independent constant, while that of carbon monoxide (CO) has negative slope. According to Boudouard reaction, carbon monoxide is the dominant compound in higher temperatures, and the higher the temperature, the more efficient reductant carbon monoxide also is.
- A substance whose formation enthalpy is lower (ΔG line lower on diagram) at given temperature, will reduce one whose formation enthalpy is higher on the diagram. Hence metallic aluminum can reduce iron from iron oxide into metallic iron, aluminum itself oxidizing into aluminum oxide. (This reaction is employed in thermite.)
- The intersection of two lines imply the equilibrium of oxidation and reduction reaction between two substances. Reduction with using a certain reductant is possible at the intersection point and higher temperatures where the ΔG line of the reductant is lower on diagram than the metallic oxide to be reduced. At the point of intersection the Gibbs energy is 0(zero), below this point the Gibbs energy is <0 and the oxides are stable,while above the point of intersection the Gibbs energy is >0 and so, the oxides are unstable.
[edit] Reducing agents
In industrial processes, the reduction of metal oxides is obtained using carbon, which is available cheaply in reduced form (as coal, which can be rendered to coke). Moreover, when carbon reacts with oxygen it forms gaseous oxides carbon monoxide and carbon dioxide, therefore the dynamics of its oxidation is different from that for metals: its oxidation has a more negative ΔG with higher temperatures. Carbon can thus act as reductive agent both in element phase and in monoxide phase. Using this property, reduction of metals may be performed as a double redox reaction at relatively low temperature.
[edit] Use of Ellingham Diagrams
The main application of Ellingham diagrams is indeed in the metallurgy industry, where it helps to select the best reducing agent for various ores in the extraction process.
[edit] Reducing Agent for haematite
During smelting of haematite ore in the blast furnace reduction takes place at the top of the furnace, where temperature is in the range of 600oC to 700oC. From Ellingham diagram we notice that in this range carbon monoxide acts as a reducing agent since the process 2 CO + O2 --> 2CO2 has a lower negative value of free energy change than the process 2C + O2 --> 2CO. Thus in the blast furnace haematite is reduced by CO even though carbon is mixed with it. Fe2O3 + 3CO --> 2Fe + 3CO2
[edit] Reducing Agent for chromic oxide-carbon cannot be used
At high temperature the Ellingham curve for the reaction 2C(s) + O2(g) --> 2CO(g) slopes down and falls below the curves for all the metals. Hence, carbon can normally act as a reducing agent for all metal oxides at very high temperatures. But chromium formed at these temperatures react with carbon to form its carbide which gives undesirable properties to chromium metal obtained. Hence, for high temperature reduction of chromic oxide, carbon cannot be used.
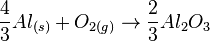
[edit] Alumino thermic process
The Ellingham curve for Aluminum always lies below the curves of metals like Cr, Fe, etc. So Aluminum can be used as the reducing agent for oxides of all these metals. This fact can be illustrated as below:
The free energies of formation of chromium oxide and aluminum oxide per mole of oxygen consumed are -540kJ and -827kJ respectively. The processes are:
 (1)
(1)
 (2)
(2)
So Aluminum oxide is more stable than chromium oxide.
Equation (2) - Equation (1) gives

- ΔG0 = − 287kJ
Since Gibb's free energy is negative, aluminium acts as the reducing agent.
In pyrometallurgy, Al is used as a reducing agent in alumino-thermic process to extract Cr and Mn by reduction of their oxides.
[edit] External links
- A good printable version of the Ellingham diagram with Metallurgy-relevant entries
- An online tutorial on Ellingham diagrams
- [1] Interactive Ellingham diagrams at San José State University
- [2] Ellingham diagram tutorial and interactive diagram (University of Cambridge)
Personal tools
Namespaces
Variants
Print/export
Languages
- This page was last modified on 31 July 2010 at 09:25.
- Text is available under the Creative Commons Attribution-ShareAlike License; additional terms may apply. See Terms of Use for details.
Wikipedia® is a registered trademark of the Wikimedia Foundation, Inc., a non-profit organization. - Contact us


