
Explain with the help of suitable graph diagram the right and left shift of oxygen dissociation curve

Dear student,
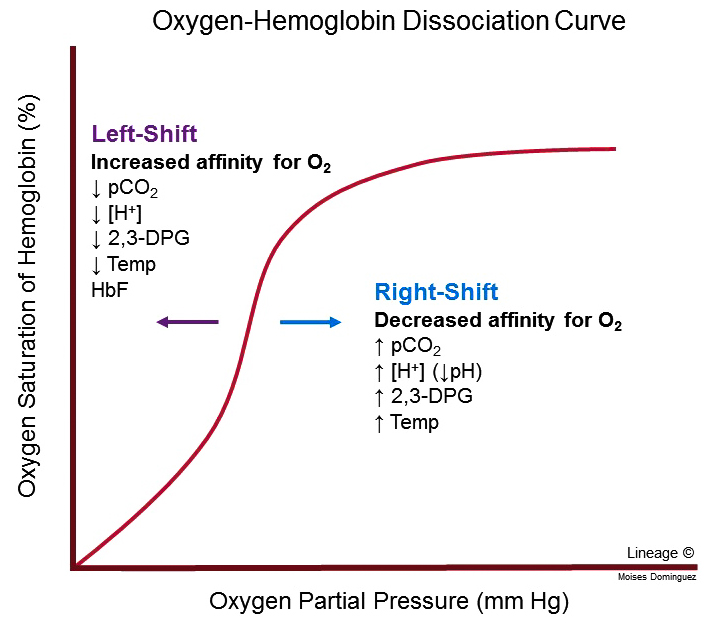
1).High PO2,low CO2,Lesser H+ concentration and lower temperature favours the formation of oxyhaemoglobin and thus shifts the curve to the left.
2).Increase in PCO2 tension in blood brings rightward shift of the oxygen dissociation curve and thereby decreases the affinity of haemoglobin for oxygen.This effect is called Bohr's effect.
Regards