

Angel Abraham answered this
- 2
Bhavika Arora answered this
- 2
Soma Datta answered this
They might be shown a tally chart like the following, used to record the favourite parts of Christmas: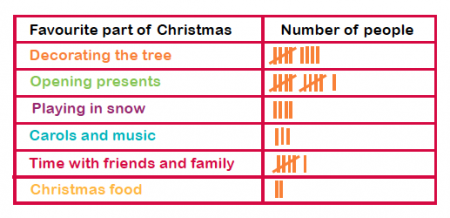
This block diagram or graph shows what kinds of vehicles were seen on a road by one child in the course of half an hour: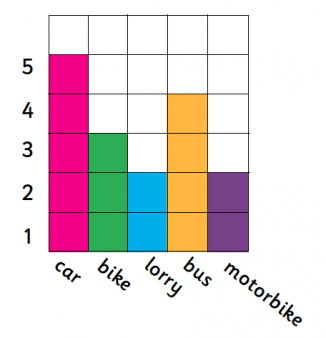
They may be shown a table like the following which shows the favourite sports of 50 children across a year group:
SPORT PREFERENCES Football 20 Rugby 7 Cricket 10 Golf 5 Hockey 8 How statistics is taught in KS1 maths
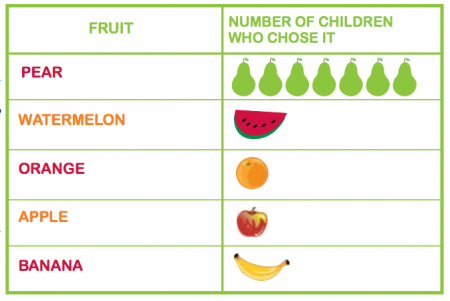
To help children understand the way the information is presented in each format, they will be asked various questions, for example: ‘Which is the most popular fruit in the class?’, ‘How many children like dogs?’, ‘How many buses were seen in half an hour?’, ‘Which is the least popular sport in the year group?’.
A good question to test children with when looking at data (and one which they tend to find quite hard at KS1 level) is: ‘How many more children like bananas than grapes?’
Children also need to understand how to analyse information to understand what the total number of people surveyed is. For example, when looking at the favourite sports table above, they would need to understand that to find the total number of children in the year goup, they would need to add up all the numbers in the right hand column.
The best way to get children really involved in data handling is to encourage them to find out their own information and show them how to record this accurately, be it in a list, table or tally chart. Teachers then demonstrate how to convert this information into a pictogram or block diagram.
Data handling in KS2 mathsIn Year 3, children continue to use the above ways to present data, but they also look at bar charts like the one below: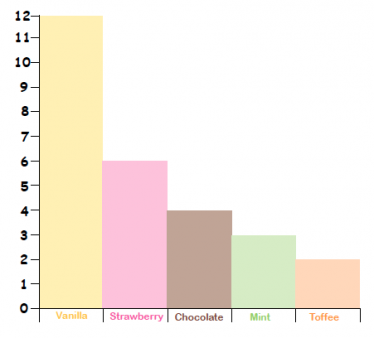
They would then move onto collecting and recording their own information and then presenting this in a bar chart. Children tend to find producing their own bar charts tricky and need plenty of help to draw an axes and then work out how to draws bars all of equal width and evenly spaced.
In Year 4, children look at both discrete and continuous data.
Discrete data is information that can only take on certain values, for example: numbers of children (you can’t have half a child). Continuous data can take any value within a range, for example: a person’s height, a cat’s weight and time taken to get to school.
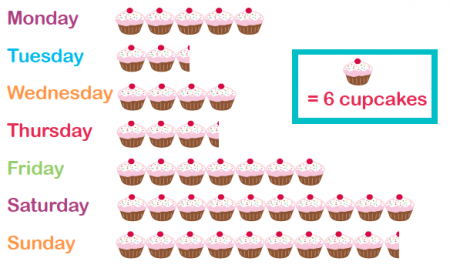
Children in Year 4 will continue to interpret and construct bar charts, pictograms and tables. The pictograms they look at may have one symbol representing a number of things, for example:
Children in Year 4 will also look at time graphs such as the following which shows the distance a car has covered over 10 minutes: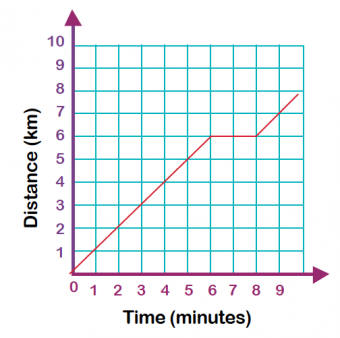
They may be asked to discuss what happened between 6 and 8 minutes (the car did not move, possibly stuck in traffic).
They also need to continue to solve comparison (which food is most popular?), sum (how many children are in the class altogether?) and difference (how many more people like hockey than tennis?) problems.
In Year 5, children continue to solve comparison, sum and difference problems using information presented in a line graph. They may look at a line graph like this one, which shows the changing temperature over a number of days: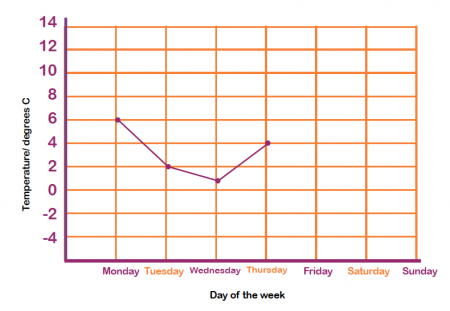
They also have to complete, read and interpret information in tables, including timetables, for example: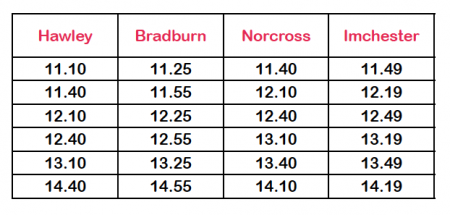
Questions they may be asked are: ‘How long does it take to get from Bardburn to Imchester on the third train?’ or ‘Which train arrives in Norcross 20 minutes before 2pm?’
In Year 6, children are taught to interpret and construct pie charts and use these to solve problems. For example: they may be given a table like the following and asked to convert it into a pie chart:
FAVOURITE SPORT NUMBER OF CHILDREN Football 10 Hockey 5 Basketball 20 Rounders 5For this, they would need to think about each of the numbers on the right and what fraction of the total number of children each one is. Since the total number of children is 40, this means that ¼ like football, ⅛ like hockey, ½ like basketball and ⅛ like rounders. They would then need to think about how to split up their pie chart (using their knowledge of the fact that a full circle is 360º, so ½ would be 180º, ¼ would be 90º and ⅛ would be 45º). The resulting pie chart would look like this: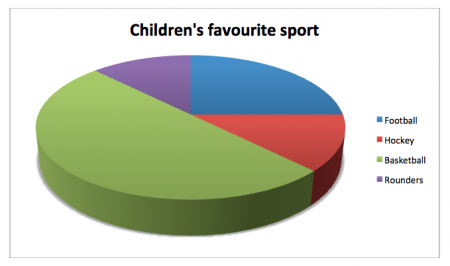
They also need to interpret and construct line graphs. For example, they might be asked to carry out an investigation, such as measuring the temperature each hour throughout the day, or measuring the weight of a growing guinea pig. They would then need to think about constructing a line graph to present this data.
Y6 children are also required. For example, they might be given the following information showing the number of minutes football practice a child called Steve has done each day for a week:
DAY NUMBER OF MINUTES Monday 65 Tuesday 35 Wednesday 35 Thursday 30 Friday 60 Saturday 60 Sunday 30To find the mean average number of minutes of football practice Steve has done each day, you would need to add all the values in the right hand column together to make 315, you would then need to divide this number by 7 (which is the number of days) to make 45. Therefore, Steve has done an average of 45 minutes of football practice a day.
- 2
Vishal Shakya answered this
- -2
Prithvinka answered this
- 0
Maruf Ahmed answered this
- 1
Raj Harshit answered this
- -3
Anika Gupta answered this
- 2
Rahul Yadav answered this
- 1
Noyonika Mukherjee answered this
- 1
Abu Backer Shaikh answered this
- 0
Abu Backer Shaikh answered this
- 0