what is pictrograph

Pictographs

A Pictograph is a way of showing data using images.

Each image stands for a certain number of things.

Example: Apples Sold

Here is a pictograph of how many apples were sold at the local shop over 4 months:

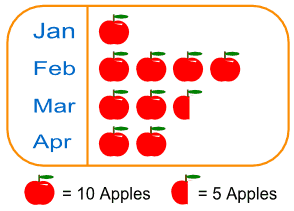
Note that each picture of an apple means 10 apples (and the half-apple picture means 5 apples).

So the pictograph is showing:

  • In January 10 apples were sold
  • In February 40 apples were sold
  • In March 25 apples were sold
  • In April 20 apples were sold

  • 1

A pictograph is a graph that shows numerical information by using pictures,symbols or icons to represent a data.

  • 0

Pictograph is the way of expressing the data with the help of pictures. A key picture is used as unit which represents a number of concerned object. For example, the pictograph showing the numbers of cars sold by a company in different years is given below:

Here, the key is "1 image of car = 1000 cars".

  • 0

pictorial representatation of data

  • 0

a graph that represent the data or information with the help of pictures

  • 0
What are you looking for?